When there is a need to control the browser using code, many people stop at opening Chrome and then simulating mouse actions. That method is slow, fragile, and difficult to scale. Chrome remote debugging opens up a different direction: you talk directly to the browser engine via the DevTools protocol, read the DOM, block requests, run scripts, and manage multiple sessions at the same time. This article goes through the operational mechanism, methods to enable and connect, common errors, and most importantly, how to use it so you do not expose automation signals to tracking platforms.
1. What is Chrome remote debugging?
Chrome remote debugging is a feature that allows an external program to connect to and control an active Chrome window through the Chrome DevTools Protocol, commonly abbreviated as CDP. Instead of simulating interface operations like mouse clicks or typing, the program sends commands directly to the browser core. As a result, Chrome can respond faster and provide access to many functionalities that interface operations cannot perform.
1.1. How does Chrome remote debugging work?
For an external program to control Chrome, the browser executes a connection workflow via the Chrome DevTools Protocol.
First, Chrome is launched with a command-line flag to open the remote debugging port. When this happens, the browser creates a small internal HTTP server and listens on the specified port, waiting for external programs to connect.
Upon receiving a request, Chrome returns a list of active targets. Targets are objects that the program can control, such as tabs, windows, or service workers. Each target has its own WebSocket address for the program to connect and exchange data with Chrome.
After a successful connection, the program sends commands in JSON format containing an id, method, and params. Chrome executes the command, returns the result corresponding to the correct id, and continuously sends new events generated during web browsing, such as page load completion, new network requests, or content changes on the page. Thanks to this, the program always tracks the real-time state of the browser.
To manage different functions, the Chrome DevTools Protocol divides commands into multiple groups, each handling a specific task.
- Page manages operations related to the web page, such as navigation, reloading, or taking screenshots.
- Network monitors requests and responses of the page.
- Runtime executes JavaScript within the context of the web page.
- DOM reads and modifies the DOM structure.
- Input simulates actions like clicking, text input, or key presses.
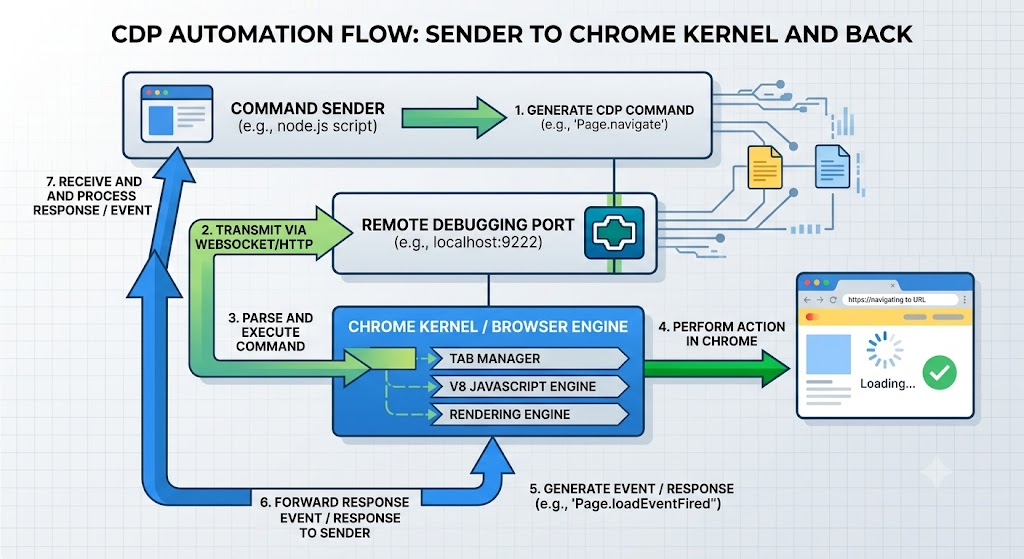
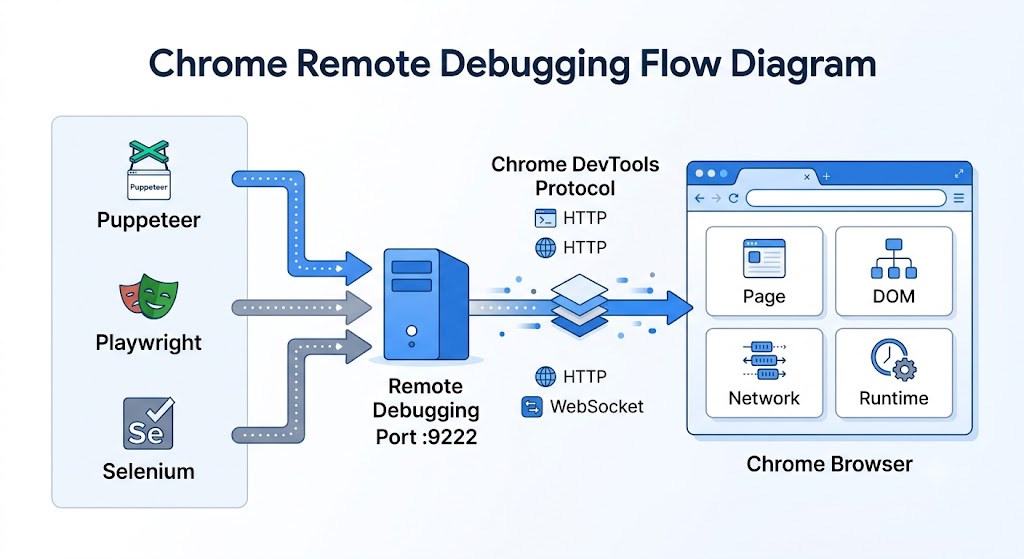
Thanks to this mechanism, Chrome remote debugging becomes the foundation for tools like Puppeteer, Playwright, and certain Selenium implementations to connect with Chrome without simulating the entire user interface. Besides serving automation, the ability to deeply access the browser also supports testing, analyzing factors related to browser fingerprinting, and how websites detect the access environment.
1.2. Remote debugging port and how to connect
For a program to connect with Chrome, the browser must first open the remote debugging port. This is where Chrome listens for external connection requests and allows both sides to communicate via the Chrome DevTools Protocol.
The default port used is usually 9222, but you can replace it with any port not currently occupied by another program. When launching Chrome, you just need to specify the desired port number in the command-line parameters.
Once successfully enabled, open a browser and navigate to the address http://localhost:9222/json. Chrome will return a list of active targets in JSON format. Each target contains information such as ID, URL, and the WebSocket address for the program to connect.
This is the initial validation step before writing or running any script code. If this address does not respond or fails to return data, it means the remote debugging port has not been opened correctly. In that case, you should recheck the configuration instead of proceeding with script writing, as subsequent connection steps will fail.
In addition to the local machine, sometimes you need to control Chrome from another device. However, note that Chrome ignores parameters intended to change the listening address and always opens the debug port strictly on 127.0.0.1 (the local machine). You cannot directly expose this port to the network using Chrome configurations. To access it from another machine, you must use an SSH tunnel or a dedicated reverse proxy layer.
1.3. Differentiating Chrome remote debugging from frequently confused concepts
When learning about Chrome remote debugging, many people often confuse this feature with Chrome DevTools, Chrome DevTools Protocol, or WebDriver. While they all relate to inspecting and controlling the browser, each concept serves a distinct role.
| Concept | Nature | Role |
|---|---|---|
| Chrome remote debugging | A Chrome feature | Opens the entry point, allowing connections from the outside |
| Chrome DevTools Protocol (CDP) | A protocol | Defines the set of commands and events running on that path |
| DevTools Panel triggered by F12 | A user interface | Acts as a CDP client running right inside the browser |
| WebDriver | A W3C standard | A separate control channel operating over HTTP; works across multiple browsers but operates at a shallower level |
Simply put, Chrome remote debugging is the gateway to connect with Chrome, while the Chrome DevTools Protocol is the language used to communicate after a successful connection. The familiar Chrome DevTools accessed by pressing F12 actually uses this protocol as well, except that it runs directly inside the browser.
2. What is Chrome remote debugging used for?
To put it briefly: the value of Chrome remote debugging does not lie in opening a tab, but in the depth of intervention. Below are four groups of capabilities, each tied to a practical use case.
2.1. Deeper control than interface operations
Through the Chrome DevTools Protocol, you can perform many operations that mouse and keyboard simulations cannot achieve.
For example, you can intercept a request before it is sent, modify headers, or block images and fonts to make pages load faster. You can also read response content immediately after the server responds without waiting for the page to render completely.
Furthermore, Chrome remote debugging allows inserting JavaScript before the website begins executing, setting breakpoints for debugging, or inspecting variable values directly during execution.
For instance, if you need to extract data from an API that a website calls implicitly, you only need to monitor requests at the Network layer instead of parsing the HTML after the page finishes loading.
2.2. Extracting data at the browser layer
Chrome remote debugging can directly access a wealth of data processed by the browser.
You can retrieve the HTML after JavaScript execution has completed rendering, instead of just pulling the initial source code from the server. This is particularly useful for websites heavily reliant on JavaScript. Beyond HTML, you can also read cookies, Local Storage, Session Storage, all page requests and responses, along with Console logs to support inspection or analysis.
Consequently, Chrome remote debugging is frequently utilized in data collection tools, website testing, and performance analysis.
Read more: Comparing local storage and session storage: Which one should you use?
2.3. Attaching to an active Chrome session
A major advantage of Chrome remote debugging is its ability to connect to an already open Chrome session.
Once connected, you can open or close tabs, switch tabs, reload pages, input data, scroll, or take screenshots without needing to restart the browser.
Crucially, the entire state of the working session remains intact, including logged-in accounts, cookies, and session data. This is why many multi-account management tools choose to connect to an existing Chrome session instead of launching a new browser instance every time.
2.4. A foundation for building automation tools
Chrome remote debugging is not a complete automation tool by itself, but rather the foundation on which other tools operate.
Through the Chrome DevTools Protocol, developers can build tools to measure performance, analyze memory, monitor CPU usage, or automatically execute various tasks on the browser.
This is also the underlying technology behind many popular libraries and tools such as Puppeteer, Playwright, and modern antidetect browsers.
Thanks to its ability to deeply intervene in Chrome, Chrome remote debugging has become a vital component in many testing, scraping, and browser automation systems.
3. Methods to enable Chrome remote debugging
For an external program to control Chrome via the Chrome DevTools Protocol, you must first enable Chrome remote debugging. This step prompts the browser to open the debugging port and prepare for external tool connections.
There are multiple ways to enable Chrome remote debugging, depending on how you use the browser. You can run standard Chrome with specific command-line arguments, utilize Headless mode, or verify the debugging port post-launch to ensure everything operates correctly.
3.1. Enabling on a pre-installed Chrome instance
Before executing the command, completely close all open Chrome windows. If a background Chrome process is still running, the launch might fail or fail to open the remote debugging port.
- Windows: Open Command Prompt or PowerShell, then run the command:
"C:\Program Files\Google\Chrome\Application\chrome.exe" --remote-debugging-port=9222 --user-data-dir="C:\ChromeDebug"
- macOS: Open Terminal, then run:
/Applications/Google\ Chrome.app/Contents/MacOS/Google\ Chrome --remote-debugging-port=9222 --user-data-dir="$HOME/chrome-debug"
- Linux: Open Terminal, then run:
google-chrome --remote-debugging-port=9222 --user-data-dir="$HOME/chrome-debug"
The three commands above only differ in the path to the Chrome executable file. Each operating system stores Chrome in a different location, so you only need to adjust this segment accordingly.
The parameter --remote-debugging-port is used to open the remote debugging port. The default port is typically 9222, but you can change it to any port not currently utilized by another program.
The parameter --user-data-dir specifies the directory storing the profile for the Chrome remote debugging session. If the directory does not exist, Chrome will automatically create it during the first launch.
3.2. Why must a separate data directory be used?
This is an important adjustment in recent Chrome versions. Starting from Chrome 136, if you enable remote debugging but continue using the default data directory, Chrome will bypass the parameter to open the debug port. The browser will still start normally, but the remote debugging port will not open.
The reason is that Google has heightened security to prevent malicious software from exploiting the debug port to harvest cookies or login credentials. By using a dedicated data directory, the Chrome session is isolated from daily-use profiles and uses a separate encryption key.
If configured incorrectly, you will encounter the message:
DevTools remote debugging requires a non-default data directory
When encountering this error, create a new data directory, restart Chrome with the --user-data-dir flag, and then log into that profile. Chrome will save all data, and you can continue using it in subsequent runs.
If you require a specific Chrome version tailored strictly for automation, you can also use Chrome for Testing.
3.3. Enabling Chrome Remote Debugging in Headless Mode
Aside from launching Chrome with a standard interface, you can also enable Chrome remote debugging in Headless mode. This mode runs the browser in the background without displaying a window while still supporting almost all Chrome features.
To use it, simply add the parameter --headless to the Chrome startup command described in the previous section.
However, if you have read older documentation, you might see two modes mentioned: --headless and --headless=old. This information is no longer accurate.
Starting from Chrome 132, Google completely discarded the old Headless mode. If run with --headless=old, Chrome will return an error instead of launching. Currently, both --headless and --headless=new deploy the exact same new Headless mode.
Compared to the legacy version, the new Headless mode shares the same browser engine as standard Chrome. Consequently, its behavior aligns much more closely with a headed browser, improving compatibility and minimizing discrepancies during automation workflows.
In cases where the legacy Headless functionality is explicitly required, Google provides a distinct binary named chrome-headless-shell. This is a lighter execution shell suitable for server environments or containers, but it is no longer the default choice inside Chrome.
Nonetheless, Headless mode still carries limitations. The browser can expose indicators such as the navigator.webdriver property, a reduced plugin list, or default window dimensions. Additionally, because there is no visual interface, observing and troubleshooting errors while a script runs is more challenging compared to standard Chrome.
3.4. Verifying if the port is enabled
After launching Chrome, you should verify the remote debugging port before writing or running any script code. This simple step can help identify configuration errors early on.
The fastest validation method is opening the address http://localhost:9222/json on a separate Chrome window. If the port is active, Chrome will return an array of active targets in JSON format. Each target includes parameters like ID, URL, and the WebSocket address for automation libraries to connect to.
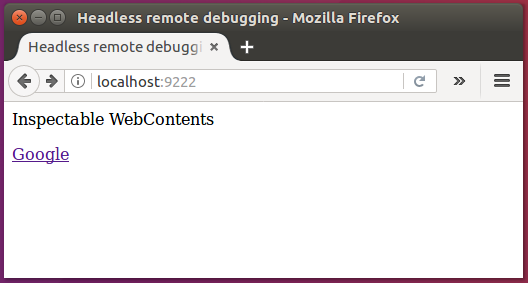
If this address fails to respond or returns no data, recheck the Chrome launch command before proceeding. Writing scripts while the port is closed only wastes time tracking errors in subsequent phases.
Alternatively, you can verify via Chrome's native tools.
Navigate to chrome://inspect, add the target address and port configuration of the Chrome session under inspection, and then select Inspect on the desired tab. If a DevTools window launches and displays the tab's contents correctly, it confirms Chrome remote debugging is fully operational.
This verification approach also underscores that Chrome DevTools is fundamentally a client of the Chrome DevTools Protocol. Instead of building a custom connection client, you can use DevTools to confirm the debug port is ready before transition to tools like Puppeteer, Playwright, or Selenium.
3.5. Comparison of methods to enable Chrome remote debugging
| Method | Has Window | Retains Logins | Detection Risk | Best Suited For |
|---|---|---|---|---|
| Standard Chrome, separate data directory | Yes | Yes, after initial login | Moderate | Learning operations, running personal scripts |
| Chrome in Headless mode | No | No | High | Screenshots, PDF generation, internal server tasks |
| Chrome for Testing | Yes | Yes | Moderate | Automation, when legacy executions are needed |
4. Connecting Chrome Remote Debugging with Puppeteer, Playwright, and Selenium
Once Chrome remote debugging is active, the next step is connecting automation tools to the active Chrome session. Popular libraries like Puppeteer, Playwright, and Selenium all natively support interacting with Chrome via the Chrome DevTools Protocol.
Before diving into individual tools, you need to understand the two primary connection models.
- Launching a new browser: The library independently launches Chrome or Chromium, creates a fresh profile, and manages the lifecycle. This approach is ideal for testing or development, but the browser session lacks cookies, browsing history, or logged-in states.
- Connecting to a running browser: Chrome is launched beforehand with remote debugging enabled, and the library connects to this existing session to assume control. This preserves all cookies, session data, and login states.
If your workflow requires working with pre-authenticated accounts or multiple managed profiles, connecting to an active Chrome session is the optimal choice.
4.1. Puppeteer
Puppeteer is a library developed by Google to control Chrome and Chromium over the Chrome DevTools Protocol. It supports both launching a fresh browser instance and connecting to an active Chrome session.
When installing Puppeteer, you will encounter two packages: puppeteer and puppeteer-core.
- puppeteer is the complete package, which automatically downloads a compatible version of Chromium. You can install and use it immediately without preparing an external browser.
- puppeteer-core solely provides the APIs to control a browser without downloading Chromium. This package is ideal when connecting to an existing Chrome session opened via remote debugging or utilizing a browser managed by an external system.
If the goal is to control a running Chrome session, puppeteer-core is generally the preferred choice as it avoids installing an redundant Chromium binary.
To connect to Chrome with remote debugging enabled, use puppeteer.connect() instead of puppeteer.launch(). The connect() method binds to the active Chrome session, whereas launch() instantiates an entirely new browser instance.
import puppeteer from "puppeteer-core"; const browser = await puppeteer.connect({ browserURL: "http://127.0.0.1:9222" }); // Retrieve active tabs instead of creating a new one const pages = await browser.pages(); const page = pages[0]; await page.goto("https://example.com");
In the example above, Puppeteer connects to the Chrome instance running on port 9222. Upon successful connection, you can fetch the active tabs list, control the desired tab, or proceed with operations like navigation, screenshots, and JavaScript execution.
A common point of confusion is the distinction between close() and disconnect().
- When using launch(), Puppeteer creates and manages the browser. Thus, calling browser.close() terminates that Chrome or Chromium window completely.
- When using connect(), Puppeteer merely attaches to an independent Chrome session. In this scenario, you should call browser.disconnect() to detach. The Chrome session continues running, and all open tabs are preserved.
If you call browser.close() after connecting via connect(), Puppeteer will shut down the working Chrome session entirely. This can cause a complete loss of session states, especially if you are using Chrome to maintain active account logins or run concurrent tasks.
If Chrome is configured on an alternate port, simply update the browserURL value accordingly. If the connection fails, verify that the remote debugging port is enabled and responding at localhost:9222/json.
4.2. Playwright
Playwright is an open-source library developed by Microsoft, supporting automation across multiple browsers including Chrome, Microsoft Edge, Firefox, and Safari. Similar to Puppeteer, Playwright can either launch a new browser or connect to a Chrome session with remote debugging enabled.
To connect to a running Chrome instance, Playwright uses the chromium.connectOverCDP() method. This method hooks into the remote debugging port and controls the existing Chrome session without launching an additional browser layer.
import { chromium } from "playwright";
const browser = await chromium.connectOverCDP("http://127.0.0.1:9222");
const context = browser.contexts()[0];
const page = context.pages()[0];
await page.goto("https://example.com");
In this example, Playwright connects to Chrome active on port 9222. Once bound, you can pull the list of BrowserContext instances and active tabs to continue control operations.
Unlike Puppeteer, Playwright does not have a disconnect() method. When connecting via connectOverCDP(), you only have access to browser.close(). This method closes the BrowserContext instances managed by Playwright and then detaches from the browser.
If you wish to keep the Chrome window open after the script concludes, do not call browser.close(). Simply let the program run to completion or exit naturally, and Playwright will stop operations while the Chrome session remains open.
Another point to note is that connectOverCDP() connects exclusively via the Chrome DevTools Protocol, meaning compatibility might not be as exhaustive as Playwright's native connection mechanism. According to official documentation, this method is suitable when controlling a pre-launched Chrome session, but certain advanced features may behave unstably or lack support.
If you do not need to attach to an active Chrome session and want to leverage Playwright's full feature set, consider using the library's native launch mechanism instead of connectOverCDP().
4.3. Selenium
Selenium remains one of the most widely adopted browser automation libraries today. Unlike Puppeteer and Playwright, which use the Chrome DevTools Protocol as their native foundation, Selenium is engineered around the WebDriver standard. However, Selenium still permits connection to a Chrome session with remote debugging enabled to control an active browser.
To achieve this, you configure ChromeDriver to point to the remote debugging port address via the debuggerAddress option.
from selenium import webdriver
from selenium.webdriver.chrome.options import Options
options = Options()
options.debugger_address = "127.0.0.1:9222"
driver = webdriver.Chrome(options=options)
driver.get("https://example.com")
In this scenario, Selenium binds to the Chrome session running on port 9222 instead of spinning up a fresh Chrome window. Once attached, you can control the browser using familiar Selenium APIs such as element location, text input, or clicks.
When deploying this method, all cookies, session data, and authenticated states within Chrome are preserved. This is highly effective if you need to continue operations inside a previously prepared browser instance.
However, not all Selenium features remain fully operational when attached to an existing Chrome session. Certain capabilities linked to browser initialization or structural configuration only take effect when Selenium spawns a fresh session via ChromeDriver.
If Selenium fails to connect, re-verify that Chrome was initiated with the --remote-debugging-port argument, that the debug port responds at localhost:9222/json, and ensure the ChromeDriver version strictly matches the active Chrome browser version.
4.4. Calling CDP directly without a library
Puppeteer, Playwright, and Selenium greatly simplify interactions with the Chrome DevTools Protocol. However, if you want to build custom tooling or maintain complete control over the communication stream with Chrome, you can interact directly with the CDP without relying on any library wrappers.
The core connection flow involves three steps.
First, dispatch an HTTP request to http://localhost:9222/json to retrieve the array of active targets. Chrome returns a JSON array where each target yields attributes like id, type, url, and webSocketDebuggerUrl.
Next, establish a WebSocket connection to the webSocketDebuggerUrl corresponding to the tab you intend to control. Once connected, all commands are transmitted as JSON messages.
A typical message payload contains three primary elements:
- id: The sequential request identifier.
- method: The command name structured as Domain.Command.
- params: The command arguments.
Chrome responds with two variations of messages. If the message includes an id field, it represents the execution result of the command you dispatched. If the id is absent, it represents an event proactively emitted by Chrome, such as page load completion or a new network request event.
Interacting directly with CDP grants total autonomy over your communication with Chrome and removes library dependencies. However, you must manually manage WebSocket connections, map request ids to their respective responses, handle connection drops, and update source code if Chrome alters protocol structures across updates.
4.5. Combining Chrome remote debugging with Hidemyacc
Chrome remote debugging merely exposes a port for external programs to control the browser. This feature does not alter the browser fingerprint or how websites identify your machine hardware.
This means Chrome sessions still carry the authentic tracking signatures of the host machine. Characteristics like Canvas, WebGL, font lists, screen resolution, time zone, or IP address can still be used by websites to link accounts together, even if each session utilizes an isolated data directory.
Furthermore, controlling Chrome via CDP can generate distinct automation footprints. If you attempt to disguise all these signals manually, you will face an extensive list of leakage vectors that require constant updates after every Chrome version release.
This is why many choose to deploy an antidetect browser.
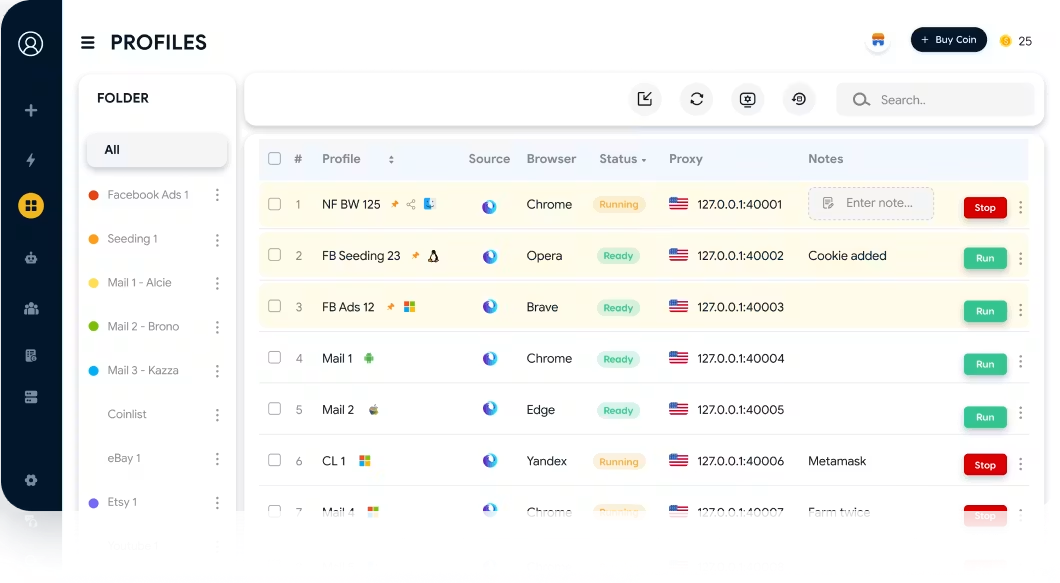
The antidetect browser Hidemyacc sets up multiple browser profiles, each configured with unique, spoofed browser fingerprints and dedicated proxies per profile. Concurrently, each profile supports opening a CDP endpoint, allowing you to connect using Puppeteer or Playwright exactly as you would with a standard Chrome session.
As a result, you can execute the entire Chrome remote debugging methodology outlined in this guide. The key distinction is that the Browser Fingerprint for each profile is treated and isolated independently, mitigating the risk of account linkage when managing multiple browser environments.
5. Common errors and misconceptions
Most of the time spent working with Chrome remote debugging is typically consumed by configuration errors or misconceptions about how the framework operates, rather than writing the actual control scripts. Certain errors block Chrome from launching the debug port entirely, while others allow the script to execute but yield unexpected outcomes.
Below are the most frequent scenarios encountered when configuring and utilizing Chrome remote debugging.
5.1. Misconception about exposing the debug port to the network
A widespread mistake is assuming that adding arguments to prompt Chrome to listen on an external address allows remote debugging connections from another device over the open internet.
In reality, Chrome is intentionally not designed to expose its debugging port directly to the internet. This mechanism operates locally through the localhost address. Thus, exposing the debug port publicly is not a secure way to connect remotely.
If you deliberately force the debug port outward using intermediary tools like reverse proxies or incorrect network routing rules, you risk exposing your entire running browser session.
Chrome remote debugging does not include a default authentication layer. Anyone who gains access to the debug endpoint can dispatch commands to control the browser, extract session data, harvest cookies, or manipulate any open tabs.
If you must control Chrome from a separate host machine, a safer architecture involves utilizing an SSH tunnel or internal communication mechanisms rather than exposing the raw debug port to the internet.
5.2. Using Chrome's default data directory
Another frequent error is enabling remote debugging while utilizing the active, daily-use Chrome user profile.
Chrome consolidates all browser states inside the user data folder, encompassing cookies, history, extensions, and session data. When multiple processes attempt to access the same profile simultaneously, Chrome can experience file locks, conflicts, or fail to spin up with the remote debugging configuration altogether.
Common symptoms include:
- Chrome opens, but scripts fail to connect.
- The debug port does not respond despite correct startup commands.
- The Chrome session terminates immediately after launch.
The mitigation is using a dedicated data directory for each remote debugging session. When executing multiple parallel Chrome instances, each session must point to an independent profile to prevent data overwrites and minimize runtime errors.
5.3. Port conflicts with other programs
Each Chrome session with remote debugging active requires an exclusive port to receive incoming connections. If multiple processes attempt to share a single port, Chrome may fail to launch, or the control program may mistakenly connect to the wrong browser session.
For example, you launch a Chrome session with:
--remote-debugging-port=9222
Subsequently, you attempt to open another instance also targeting port 9222. The second instance will hit a failure because the port is already bound.
Mitigation workflow:
- Identify which process is holding the port.
- Terminate stale or unused Chrome sessions.
- Assign distinct ports per profile when running concurrent sessions.
Proactive port management ensures system stability, particularly when linking Chrome remote debugging with automation frameworks like Puppeteer, Playwright, or Selenium.
5.4. Misunderstanding the "anonymity" of Chrome remote debugging
Another common misstep is modifying only the User-Agent string and assuming that websites will fail to recognize the browser instance.
The User-Agent is merely one signal among an extensive array of metrics deployed by modern platforms to evaluate an access environment. Modifying this string does not reshape the structural identity of the browser or host hardware.
Websites can extract an array of alternative tracking metrics, including:
- Canvas Fingerprint.
- WebGL Fingerprint.
- Font listings.
- Screen dimensions and color depth.
- Time zone offsets.
- Browser core languages.
- IP addresses.
- Browser runtime execution responses.
Additionally, automation via CDP introduces unique telemetry signatures, such as precise operation intervals, repetitive behavioral loops, or structural anomalies distinct from organic human usage.
Therefore, Chrome remote debugging only solves the technical problem of connecting to and controlling a browser; it does not mask the identity of that browser. To manage multiple isolated browser identities, users combine remote debugging with fingerprint management solutions like the antidetect browser Hidemyacc to build independent profiles with custom configurations.
Quick troubleshooting reference:
| Error Message Encountered | Typical Root Cause | Resolution Step |
|---|---|---|
| Cannot connect to Chrome | Port not active, or targeted the wrong port number | Access the localhost address with the port via a browser to verify first |
| Port 9222 is already in use | A legacy browser process has not exited cleanly | Terminate the stale process or assign an alternate port |
| DevToolsActivePort file doesn't exist | Chrome failed to initialize with the provided flags | Isolate the user data directory and terminate all active background Chrome processes |
| Connection refused | Chrome terminated unexpectedly, or firewall rules are blocking traffic | Confirm the process is live and evaluate local firewall policies |
| Chrome closes immediately after opening | Profile lock conflicts or missing write permissions on the data directory | Switch to an alternate user data path with verified write permissions |
6. Crucial considerations when enabling Chrome remote debugging
When working with Chrome remote debugging, successful connectivity is only part of the equation; managing browser sessions safely, maintaining stability, and controlling observable footprints are equally essential to runtime success.
Key considerations to remember:
- Restrict listening strictly to the local machine. The remote debugging port lacks native authentication. Exposing this port outward allows unauthorized third parties to intercept and control your active Chrome session. If remote access from another machine is required, deploy an SSH tunnel instead of opening direct port forwarding rules to the public internet.
- Close the debug port when idle. An active Chrome instance with remote debugging enabled can serve as an unintended access point if left unattended for extended periods, particularly within shared or server environments.
- Isolate user data directories and ports per session. Every distinct profile should run an exclusive user-data-dir and unique remote debugging port to avert profile lock collisions, cross-session command routing errors, or accidental state overwrites.
- Avoid mixing environments for disparate tasks. Chrome instances designated for automation should remain strictly separated from daily personal browsers to safeguard individual cookies, personal extensions, and identity credentials.
- Maintain structural browser profile consistency. When executing across multiple parallel sessions, ensure environmental factors like proxies, time zones, language arrays, screen resolutions, and device hardware structures are accurately aligned to prevent anomalous footprint configurations.
- Regulate automation velocity and interaction heuristics. Executing interaction streams at extreme velocities or maintaining perfectly identical loops can generate stark behavioral patterns that trigger anti-bot mitigation defenses.
- Monitor protocol evolutions across Chrome version updates. The Chrome DevTools Protocol undergoes revisions alongside browser updates. Routinely audit compatibility between updated Chrome builds and dependencies like Puppeteer, Playwright, or Selenium before upgrading production infrastructure.
- Review platform terms of service. Chrome remote debugging is exclusively a technical mechanism to enable browser interaction. The technical feasibility of an automated workflow does not imply compliance with a targeted platform's usage policies.
Chrome remote debugging is an effective mechanism to expand browser control capabilities, but operational efficacy and security rely entirely on your implementation architecture. Establishing accurate configurations from the outset, isolating individual browser sessions, and regulating runtime environments minimizes script failures while providing a stable framework for constructing scaled automation systems.
Read more: Guide to using proxies on Hidemyacc
7. Conclusion
Chrome remote debugging can be approached through three operational layers. At the fundamental tier, launching the debug port requires adding basic command-line arguments during Chrome startup. At the intermediate tier, interfacing with the open port is straightforward, with libraries like Puppeteer, Playwright, or Selenium managing the underlying communication protocol. However, the advanced tier requires robust profile management, maintaining infrastructure stability, and regulating technical signals visible to web platforms.
If you are getting started, manually activate remote debugging to observe how Chrome tracks targets, exposes endpoints, and processes commands. Subsequently, transition to attaching scripts to pre-launched sessions to maintain authenticated credentials and session states. When scaling automation against platforms equipped with sophisticated bot-detection mechanisms, integrate comprehensive fingerprint management architectures rather than treating individual leakage symptoms sequentially.
8. FAQ
1. Is Chrome remote debugging the same as Chrome DevTools?
No. Chrome remote debugging is a feature that opens a communication port to enable external browser control. Chrome DevTools refers to the native graphical inspector panel triggered via F12. Interestingly, the built-in DevTools panel interacts with the browser engine using the exact same underlying protocol, except it executes directly within the browser rather than from an external process.
2. Does enabling Chrome remote debugging require installing extra software?
No. It is a native capability embedded directly inside Chrome; it simply requires initiating the browser execution with the appropriate command-line flags. Automation libraries like Puppeteer or Playwright are only necessary when writing scripts to control the browser, whereas Chrome itself is entirely sufficient to verify port activation.
3. What is the default port, and can it be changed?
Port 9222 is widely used by convention within the developer community. You can change it to any unoccupied port on your host system. When executing multiple profiles concurrently, assigning a unique, dedicated port to each instance is highly recommended from the start.
4. Can websites detect if a browser is controlled via CDP?
Yes. Web applications can parse diverse telemetry indicators including navigator attributes, Canvas and WebGL rendering outputs, system font arrays, header ordering, and interaction cadences. Modifying only the User-Agent string does not resolve this vector. The optimal mitigation involves deploying an antidetect browser layer that manages fingerprint signatures, routing individual profiles through dedicated proxies, and introducing randomized delays into execution scripts.
5. Is Chrome remote debugging safe to use?
It is secure provided you restrict the listening socket strictly to the local loopback interface (127.0.0.1) and close the port after use. Exposing this port directly to the internet presents a severe security risk; the debugging endpoint does not require authentication, meaning anyone who establishes a connection can extract active cookies and manipulate your accounts directly.