Have you changed your proxy and configured a separate fingerprint for each profile but still encountered checkpoints or website access restrictions? This suggests that managing a browser environment involves more than changing a few settings. Behind every visit, websites may analyze multiple types of data to determine whether a visitor is a real user or a bot.
So, how do bot detection techniques work, and can antidetect browsers be detected? This article explains these mechanisms and the factors that influence how websites identify automated browser activity.
1. What Is a Headless Browser and How Is It Different from a Regular Browser?
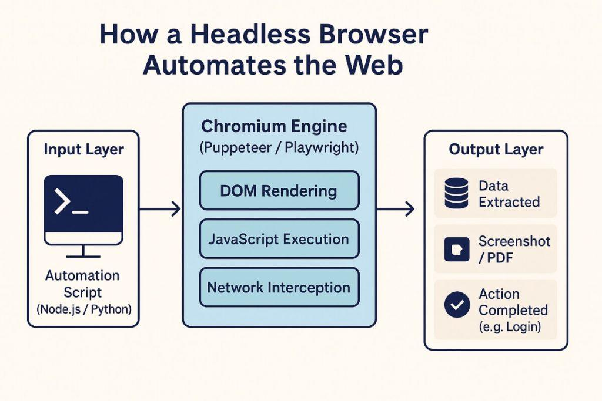
A headless browser is a browser that runs without a visible graphical interface and is commonly controlled through code using Puppeteer, Playwright, or Selenium. It can still load web pages, execute JavaScript, and send requests just like a regular browser. Therefore, websites need to examine differences in the browser environment and its operation to identify automated traffic.
1.1. What Is the Difference Between Headless, Headful, and Automation?
To understand how websites detect headless browsers, you first need to distinguish between two concepts: display mode and browser control method. Headless describes whether a browser displays a visible window, while automation refers to controlling the browser through scripts.
These three common scenarios can be distinguished as follows:
| Browser Type | Visible Browser Window? | Controlled by a Script? |
|---|---|---|
| Regular Chrome | Yes | Not necessarily |
| Headless Chrome | No | Usually |
| Chrome Headful + Puppeteer | Yes | Yes |
The key point is that headless does not mean automation. A browser with a visible interface can still be controlled automatically through Puppeteer or Playwright. Conversely, the absence of a visible window does not automatically prove that the browser is performing bot activity.
For example, when you run Puppeteer in headful mode, Chrome still opens a regular browser window, but its actions can be performed through scripts. Therefore, websites do not simply check whether a browser has a graphical interface. They may also examine signals related to how the browser is being controlled.
1.2. How Are New Headless Chrome and chrome-headless-shell Different?
Headless Chrome has undergone several important changes across different versions. Previously, headless mode used a separate implementation that did not share all the source code with regular Chrome. As a result, the headless environment had certain differences that bot detection tools could use as indicators.
Today, the new headless mode has been unified with the regular headful implementation. Specifically, starting with Chrome 112, headless mode uses the same browser code as regular Chrome but does not create a visible window. In Chrome 132, the old headless mode was moved to a separate executable called chrome-headless-shell, distributed through Chrome for Testing.
When using Puppeteer, you may encounter two options:
- headless: true: Runs Chrome in the new headless mode.
- headless: 'shell': Runs the chrome-headless-shell executable using the old headless implementation.
This distinction is important when researching headless browser detection. Some tutorials written during the old headless era may rely on characteristics that no longer accurately represent current Chrome versions. Therefore, when reviewing test results or technical documentation, you should check the Chrome version and configuration being used.
Websites primarily detect headless browsers to distinguish legitimate users from automated traffic, such as large-scale data collection, password-guessing login attempts, or fake advertising clicks. However, detection does not always result in an immediate access block. An anti-bot system may evaluate additional signals before requiring CAPTCHA verification or applying an appropriate restriction.
2. What Signals Do Websites Use to Detect Headless Browsers?
Websites detect headless browsers by combining multiple groups of signals rather than relying on a single characteristic. The data being examined may come from HTTP headers, JavaScript properties, browser control protocols, device environments, user interaction behavior, and network connections.
Each group of signals reveals a different aspect of the browsing environment. For example, the User-Agent provides information about the declared browser, while navigator.webdriver indicates whether the browser is being controlled through automation. When multiple pieces of information do not match, websites have additional grounds to assess whether a visit is unusual.
2.1. HTTP-Level Signals
When you visit a website, your browser sends HTTP headers that provide the server with certain information about your device and browsing environment. Websites can analyze these data before performing more detailed checks through JavaScript.
Some commonly examined signals include:
- User-Agent containing HeadlessChrome: Certain Headless Chrome configurations may send a User-Agent string containing HeadlessChrome. Websites can read this value directly from server-side requests or through the navigator.userAgent property in the browser. However, this string does not appear in every headless configuration, so it cannot be used alone to reach a conclusion.
- Client Hints inconsistent with User-Agent: Client Hints provide additional information about the browser brand, version, operating system, and device through headers such as Sec-CH-UA and Sec-CH-UA-Platform. If the User-Agent declares one Chrome version while Client Hints provide unrelated information, websites may record this inconsistency.
- Missing or unusual headers: Headers such as Accept-Language indicate the browser's preferred language. If this information is missing or inconsistent with other data, the system may treat it as a signal requiring further investigation.
Keep in mind that HTTP headers can vary depending on the browser, version, and configuration. Therefore, websites generally need to compare them with other signals instead of treating one individual value as conclusive evidence. Chrome also provides the User-Agent Client Hints mechanism to communicate browser information in a more structured way.
2.2. Signals from JavaScript Properties
After a page loads, JavaScript can access various browser properties to inspect the environment in which it is running. This is one of the common ways anti-bot systems look for signs of automation.
Some notable properties include:
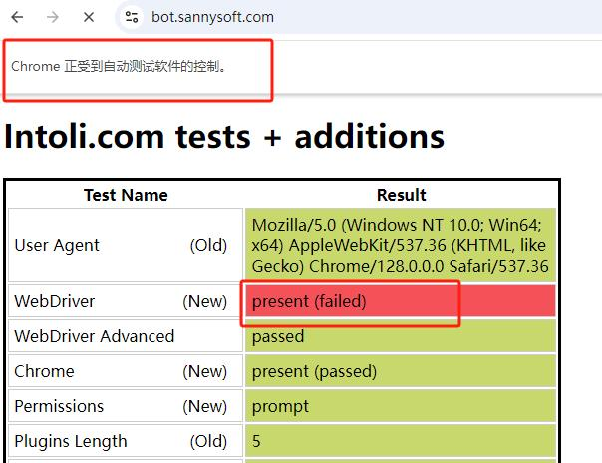
- navigator.webdriver: This property indicates whether the browser is being controlled through automation using the WebDriver mechanism. According to the W3C standard, it returns true when the WebDriver flag is active. In Chrome, this property may return true when the browser is launched with certain flags, such as --enable-automation, --headless, or --remote-debugging-port set to port 0. You should distinguish navigator.webdriver from headless mode because it relates to browser automation status, not exclusively to headless operation.W3C+1
- WebGL renderer: WebGL allows websites to access information related to a device's graphics processing capabilities. In some environments without a suitable GPU, the browser may use a software graphics renderer such as SwiftShader. If this information does not correspond to the declared operating system or device configuration, websites may record the discrepancy.
- Screen and window dimensions: Values such as screen.width, screen.height, window.innerWidth, and window.outerWidth provide information about the available display area. Some automation configurations may produce default dimensions or inconsistencies between these properties.
You can check some basic information by opening Developer Tools in your browser and entering the corresponding JavaScript commands in the Console. However, these results only reflect the environment at that particular moment. They cannot tell you with certainty how another website will evaluate your browser.
You can use the following code to quickly inspect several properties:
2.3. Chrome DevTools Protocol Traces
In addition to properties that can be accessed directly through JavaScript, websites may also look for signs generated when an external tool controls the browser. One mechanism related to this process is the Chrome DevTools Protocol (CDP).
CDP is a protocol that allows external tools to communicate with and control Chrome. It is also the protocol used by Chrome DevTools and supports browser automation tools such as Puppeteer and Playwright.
When connected to Chrome, an automation tool can send CDP commands to activate the necessary functions. For example, Runtime.enable allows a tool to receive events related to the JavaScript environment. Certain operations performed through CDP may change how the browser processes or displays information in the Console, creating signals that websites can examine.
If these signals differ from the behavior typically observed in regular browsers, an anti-bot system may treat them as evidence that the browser is being automated. However, CDP traces do not always indicate bot activity. Users who open Chrome DevTools to inspect a website may also produce some similar effects. Therefore, detection systems need to combine additional signals before reaching a conclusion.
Furthermore, detection techniques based on CDP and the Console can change across browser versions. Some methods that were once widely used have been modified or fixed. Therefore, you should not rely on an outdated detection script to determine whether a browser is currently being automated.
2.4. Signs of a Modified Browser Environment
A browser can expose various types of information about its operating system, device, and hardware capabilities. If some properties are modified while related data remain unchanged, websites may identify inconsistencies.
There are two notable groups of signals:
- Overridden properties that do not match their native implementation: Some scripts may change the values of properties such as navigator.webdriver or other browser information. However, improper modifications can also affect getters, prototypes, or how properties are accessed. Websites may inspect these characteristics to identify manipulated data.
- Conflicting device information: For example, the User-Agent may declare Windows, while certain platform information, fonts, or WebGL properties do not match. Similarly, the time zone and IP location may create an inconsistent combination if the context of use is not considered.
These data are commonly examined during browser fingerprint analysis. You can learn more about how websites collect and compare device information in our article about browser fingerprinting.
2.5. User Interaction Signals
Not all bot detection methods focus on technical browser properties. Websites may also analyze how users interact with a page, including mouse movements, scrolling, typing, and the time between actions.
Some behaviors that may attract attention include:
- The mouse moves along paths that are too straight or consistently follows the same trajectory.
- A form is completed and submitted almost immediately after the page loads.
- Visitors perform multiple consecutive actions with identical time intervals.
- A page is scrolled or clicked in the same sequence across multiple visits.
However, you should not automatically assume that users who interact quickly or do not move their mouse are bots. Real users may use keyboard shortcuts, assistive tools, or directly interact with the specific elements they need on a page. Therefore, behavioral signals need to be evaluated in context and combined with other activities.
2.6. Network Signals
In addition to browser characteristics and user interaction, network information also helps websites evaluate the source of traffic. Some anti-bot systems examine IP reputation, network type, and connection characteristics to determine whether a visit appears unusual.
Two commonly examined groups of data are:
- IP reputation: Websites may evaluate the history and reputation of an IP address. For example, an IP previously associated with multiple suspicious login attempts or a high volume of requests may be classified as high risk. Datacenter IPs may also be evaluated differently from residential IPs, depending on each platform's policies.
- TLS fingerprint: A TLS fingerprint reflects certain characteristics of the encrypted connection establishment process. If this information does not match the declared browser or environment, the system may record an inconsistency.
Network signals do not directly reveal whether a browser is running in headless mode. Instead, they provide additional information about IP addresses, connection characteristics, and the reputation of the traffic source, helping websites assess whether a visit shows signs of unusual activity.
Quick Comparison of Detection Signals
Each group of signals provides a different type of information. The following table helps you understand what websites may examine and the possibility of mistakenly identifying legitimate users in each case.
| Signal Group | Layer | What Websites Examine | Potential for False Positives |
|---|---|---|---|
| User-Agent and Client Hints | HTTP + JS | HeadlessChrome strings, inconsistent browser brands or versions | Depends on the configuration |
| navigator.webdriver | JS | Whether the browser is being controlled automatically | Low |
| CDP traces | JS | Side effects when Runtime.enable is activated | Possible, such as when users open DevTools |
| WebGL renderer and screen dimensions | JS | Software renderers, default window dimensions | Medium, such as virtual machines or devices without GPUs |
| Modified environments | JS | Non-native getters, conflicting information | Low |
| Interaction behavior | Behavior | Interaction timing and movement patterns | Medium |
| IP and TLS | Network | IP reputation and TLS fingerprints | Medium |
Websites generally do not rely on a single signal to evaluate a visit. Instead, they combine data from the browser, user interaction, and network connection. One unusual indicator is not enough to prove that a user is running a headless browser. However, when multiple signals appear together, the system may consider the visit to be higher risk.
2.7. Which Older Headless Detection Techniques Need to Be Rechecked?
When researching headless browser detection, you may come across many tutorials listing properties such as navigator.plugins, navigator.languages, window.chrome, and WebRTC as ways to identify headless browsers. These indicators frequently appear in documentation about older versions of Headless Chrome.
However, Chrome changed its headless implementation starting with version 112. The new headless mode shares its source code with regular Chrome, while the old implementation was separated into chrome-headless-shell starting with Chrome 132. As a result, characteristics that were once considered common indicators do not necessarily reflect the current headless environment accurately.
You should treat the following properties as points to check against the relevant browser version rather than definitive evidence that a browser is running in headless mode.
| Common Detection Technique | Historically Associated With | How to Check |
|---|---|---|
| Empty navigator.plugins | Older Headless Chrome according to legacy articles | Run navigator.plugins.length in the browser Console using your current configuration |
| Empty navigator.languages | Older Headless Chrome according to legacy articles | Check navigator.languages |
| Missing window.chrome | Older Headless Chrome according to legacy articles | Check window.chrome |
| Missing WebRTC | Older Headless Chrome according to legacy articles | Check whether WebRTC APIs are accessible |
For a more accurate assessment, you should run the same test in regular Chrome and in the headless configuration you are using. The results become more meaningful when accompanied by the Chrome version, operating system, and specific framework. You can also refer to the self-testing procedure in Section 5.2.
Note that navigator.webdriver and a User-Agent containing HeadlessChrome are separate signals. They should not be grouped with older detection techniques that need to be rechecked. Both indicators still need to be evaluated according to the specific browser configuration and version.
3. How Do Websites Detect Puppeteer, Playwright, and Selenium?
Each browser automation framework has its own operating mechanism and technical characteristics. Puppeteer and Playwright commonly use the Chrome DevTools Protocol when controlling Chromium, while Selenium operates through WebDriver. These differences may create signals that websites can use to identify automated activity.
However, you should not treat any individual indicator as a characteristic that always appears in every version. The results also depend on the browser, framework, and launch configuration.
3.1. Detecting Puppeteer
Puppeteer is a Node.js library that allows users to control Chrome or Chromium through code. It is commonly used for interface testing, taking website screenshots, data collection, and automating browser tasks.
When running, Puppeteer may leave several signals, including:
- CDP connections: Puppeteer uses the Chrome DevTools Protocol to send commands and receive data from the browser. Some activities related to this protocol may create traces that websites can observe.
- Scripts injected into pages: Puppeteer can inject scripts into the webpage environment to support browser control and activity monitoring. In some cases, traces of these scripts may appear in stack traces, such as the pptr: string. However, this is not a fixed indicator across all versions.
- Default headless mode: Puppeteer currently uses the new headless mode by default. If you want to run Chrome with a visible interface, you can set headless: false. Changing the display mode does not change the automation nature of the framework.Puppeteer+1
For example, you may use Puppeteer to automatically open a product page and take screenshots on your personal computer. When you move the same script to a VPS, the website may start requiring CAPTCHA verification or restricting access. The cause may be differences in the IP address, browser environment, or automation signals detected by the website.
3.2. Detecting Playwright
Playwright is a browser automation framework that supports Chromium, Firefox, and WebKit. It is commonly used for interface testing, checking user workflows, and automating website tasks.
When analyzing Playwright activity, websites may examine several indicators:
- Bundled Chromium version: According to Playwright documentation, each framework version uses corresponding browser versions. By default, Playwright may run its bundled Chromium build rather than branded Google Chrome. Differences in browser versions and browser information may cause Client Hints to differ from those of a regular Chrome configuration.
- Initialization scripts and global variables: Playwright can inject scripts into pages when creating a context or initializing the environment. Some traces related to this process may be examined through JavaScript.
Nevertheless, these indicators need to be checked against the specific Playwright and Chromium versions. You should not assume that simply using Playwright means a website will always detect automated activity.
3.3. Detecting Selenium
Selenium is a widely used browser automation suite for software testing. Unlike Puppeteer and Playwright, Selenium operates through WebDriver, a standard that allows external programs to control browsers.
Websites may pay attention to several related indicators:
- WebDriver: Selenium uses the WebDriver mechanism to send browser control commands. The navigator.webdriver property may indicate that the browser is being controlled automatically through this mechanism.
- ChromeDriver traces: In some ChromeDriver configurations, variables with the cdc_ prefix have historically been identified as Selenium-related indicators. However, their appearance depends on the version and implementation, so they should not be treated as characteristics that always exist.
Therefore, Selenium may leave different traces from Puppeteer and Playwright because it uses the WebDriver control channel. You can refer to the W3C WebDriver standard to better understand this mechanism.
Framework Comparison
To better understand the differences, you can refer to the following summary:
| Framework | Control Channel | Potential Framework-Specific Signals | Version-Dependent? |
|---|---|---|---|
| Puppeteer | CDP | Scripts injected into pages, pptr: strings | Yes |
| Playwright | CDP | Client Hints, initialization scripts, global variables | Yes |
| Selenium | WebDriver | ChromeDriver traces, cdc_ variables | Yes |
The signals in this table are for reference only and are not fixed characteristics of each framework. When investigating a specific case, you should check the relevant browser version, framework, and technical sources.
4. How Is Chrome Remote Debugging Related to Automation Detection?
Chrome Remote Debugging is a mechanism that allows external tools to connect to Chrome to inspect and control the browser. Meanwhile, the Chrome DevTools Protocol (CDP) is the protocol used to carry out this communication.
Three concepts need to be clearly distinguished:
- Remote debugging port: A connection port opened when Chrome is launched with the --remote-debugging-port option.
- Chrome DevTools Protocol (CDP): A protocol that allows tools to send commands to and receive data from Chrome.
- CDP traces: Changes or side effects that may appear in the page environment when a tool uses CDP to control the browser.
The important point is that a website observing CDP traces within a page does not mean it can directly access the remote debugging port on your computer.
Chrome also changed how remote debugging options work starting with version 136. According to Google's announcement on March 17, 2025, the --remote-debugging-port and --remote-debugging-pipe options are no longer accepted when used with Chrome's default data directory. Users need to specify a separate directory using --user-data-dir to continue using this mechanism. The change was introduced to improve the protection of cookies and login information. Chrome for Testing is not affected by this adjustment.
If you use remote debugging for development or testing, you should follow several security principles:
- Do not expose the debugging port to external networks unless necessary.
- Do not use your primary Chrome profile containing personal account sessions for debugging activities.
- Use a separate data directory to isolate the testing environment from regular browsing data.
5. How to Check Which Signals Your Automated Browser Is Exposing
You can use several fingerprint testing websites to inspect the information your browser is exposing. This approach helps you identify differences between regular Chrome and configurations running through Puppeteer, Playwright, or Selenium.
However, no single testing website can represent an entire anti-bot system. Each tool focuses on different groups of signals, so you should combine results from multiple sources.
5.1. Recommended Testing Websites
Below are several tools you can use to inspect browser properties and the consistency of your environment.
- bot.sannysoft.com: Bot Sannysoft provides several tests related to navigator.webdriver, plugins, permissions, and other browser properties. Results are displayed directly on the page, allowing you to identify which checks show unusual indicators.
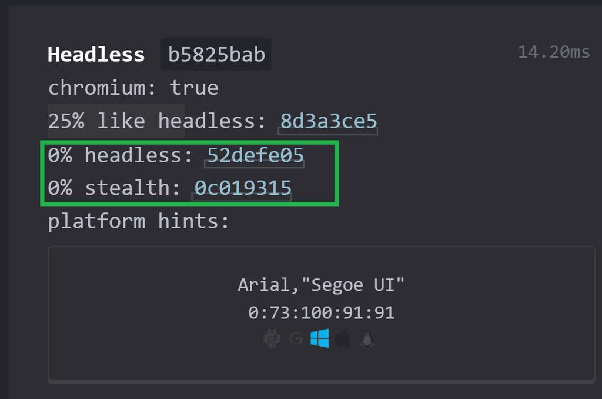
- CreepJS: CreepJS analyzes multiple browser properties to identify inconsistencies or signs of environmental manipulation. The tool also provides evaluations related to headless browsers and fingerprinting, helping you better understand the browser data being exposed.
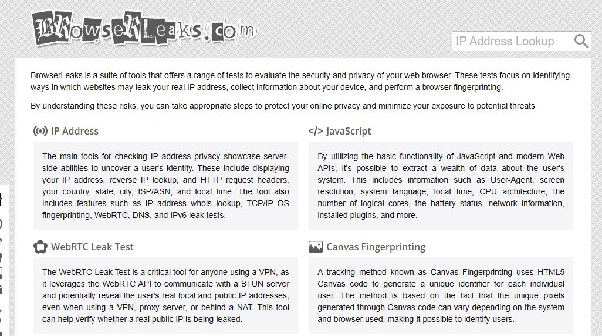
- BrowserLeaks: BrowserLeaks provides individual tests for WebGL, Canvas, WebRTC, and various other properties. Rather than providing a general conclusion about automation, the website helps you inspect each component of the information your browser exposes.
- Pixelscan: Pixelscan checks information related to browser fingerprints, IP addresses, and consistency between these data points. Its results can help you identify certain inconsistencies in your browser configuration.

Keep in mind that passing these tests does not mean a real website will accept your visit. Anti-bot systems may use additional behavioral data, IP history, and server-side analysis models that public testing tools cannot fully simulate.
5.2. A Five-Step Self-Testing Process
To make your results meaningful, you should test regular Chrome and the automated browser under the same conditions. The following process helps you identify differences between the two environments systematically.
- Record your configuration: Identify the Chrome version, framework, operating system, and browser launch flags being used.
- Test regular Chrome: Open the fingerprint testing websites in Chrome without automation to collect baseline results.
- Run the automated configuration: Use the same websites with your script in both headless and headful modes to collect results.
- Compare the data: Compare individual properties across test sessions and record any differences.
- Save the results: Take screenshots, record the testing date, and save the browser version so you can compare results after each update.
During testing, you should keep other factors unchanged, including the operating system, network connection, and device. If you change too many settings at once, it becomes difficult to identify why the test results differ.
5.3. What Can Hidemyacc Help With, and What Can It Not Help With?
Antidetect browser Hidemyacc is a tool that supports creating and managing browser profiles with separate fingerprints, combined with proxies to manage browsing environments. When using Hidemyacc, each profile has its own cookies, proxy, and fingerprint, helping maintain consistency across the environment information discussed in Section 2.4. However, Hidemyacc does not change the underlying nature of automation. Signals related to how scripts control browsers through CDP or how users interact with websites may still be detected.
If you need to integrate automation tools, you can also refer to the official Hidemyacc documentation for information about the Profile API.
6. Conclusion
Websites do not detect headless browsers simply by checking whether a browser has a visible interface. Instead, anti-bot systems may combine information from HTTP headers, JavaScript, CDP, fingerprints, network connections, and user interaction behavior to evaluate a visit.
This also explains why switching from headless to headful mode or simply changing the User-Agent may not solve the problem. A browser can still expose automation signals through the way it is controlled or through inconsistencies in its environment.
If you are developing or testing applications, use the tools in Section 5 to examine differences between regular browsers and automated environments. If you manage multiple accounts, you should pay attention to the consistency of fingerprints, proxies, and data within each profile while also complying with the policies of the platforms you use.
Understanding how websites detect bots will help you choose and manage browser environments more effectively instead of focusing on changing individual settings in isolation.
Read more: Antidetect Browser for Web Scraping: Top Tools 2026
7. FAQ
1. Does navigator.webdriver being true mean that an account will be suspended?
Not necessarily. navigator.webdriver is only an indicator that the browser is being controlled automatically through the WebDriver mechanism. Websites may combine this information with fingerprints, behavior, and access history to assess risk. Whether an account is asked to verify its identity or restricted depends on each platform's policies.
2. Can opening DevTools while browsing cause a user to be mistakenly identified as a bot?
It is possible. Some automation detection techniques based on CDP may record side effects when Chrome DevTools is open. However, this is not sufficient evidence to conclude that a user is a bot. Anti-bot systems generally need to examine additional signals before making a decision.
3. Does running Puppeteer in headed mode still count as automation?
Yes. Headless and headful modes only indicate whether the browser displays a visible window, while automation refers to controlling the browser through scripts. Therefore, Puppeteer running in headed mode may still expose signals related to CDP or automated browser control.
4. Can websites see whether Chrome has opened a remote debugging port?
Websites can generally observe effects generated within a page when a browser is being controlled, rather than the remote debugging port itself. CDP traces do not mean that a website can access the debugging port on your computer. Whether a webpage can check a local port needs to be verified separately for each specific case.
5. Can Hidemyacc prevent automated scripts from being detected?
It is not possible to guarantee that Hidemyacc will prevent automated scripts from being detected. The tool supports managing profiles with separate fingerprints, cookies, and proxies, helping maintain a consistent browser environment. However, signals related to CDP, how scripts control the browser, and user interaction behavior may still be detected by websites.